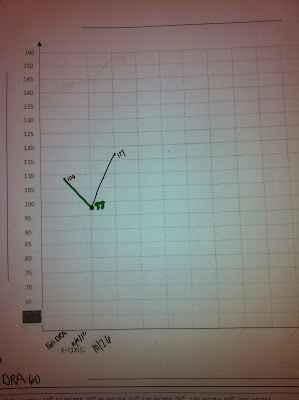
The kiddos have been graphing their multiplication timed test scores and their WCPM (Words correct per minute) on individual graphs, so it seemed logical to add up the scores and graph our class WCPM.
 |
| Here is an example of a student's progress chart for reading fluency |
 |
| Another student chart. Look at that jump! |
.JPG) |
| Here is our class chart. We only have one of the fluency assessments added up for the whole class. Our first number is wayyyyyy at the bottom in red. |
I have recently been to a workshop on L to J, by Lee Jenkins. He makes a lot of really good points about a class being a team and everyone graphing data in multiple ways. He says to use L to J charts, scatterplots, class run charts, student run charts, and item analysis graphs, to name a few.
I knew I wanted to get started charting, so this fluency chart was my interpretation of a class run chart. I am pretty sure Dr. Jenkins would view this as a very loose interpretation, but I had to take action quickly, before I lost my momentum!
How do you track student learning?
Information on L to J:
If you are interested in reading his book, go here: Permission to Forget
This is his website: ltojconsulting.com


No comments:
Post a Comment
Your comments make my day:)